A mutual fund may deliver reasonable returns. But it should be checked whether the fund took significantly more risk than another fund to achieve it.
This is where the Sharpe ratio becomes useful.
It helps investors compare an investment's return with the volatility taken to generate it. A higher return does not necessarily mean that an investment has delivered better risk-adjusted performance, as the bigger question is if the volatility was worth the higher return. It is at this point where the Sharpe ratio comes into play.
What is the Sharpe Ratio?
The Sharpe ratio is a risk-adjusted performance measure that shows how much excess return an investment generates for each unit of risk.
It was developed by economist William F. Sharpe and is widely used to compare investments based on their risk-adjusted returns.
The ratio considers the investment's return, the risk-free rate and the investment's volatility.
In simple terms, it asks:
"How much additional return did I earn for the risk I took?"
A higher Sharpe ratio generally indicates better risk-adjusted performance.
How Is the Sharpe Ratio Calculated?
Calculating the Sharpe ratio involves three figures:
1. Investment return:
The return generated by the fund or portfolio.
2. Risk-free rate:
The return available from an investment considered relatively risk-free.
3. Standard deviation:
A measure of how much the investment's returns fluctuate.
First, subtract the risk-free rate from the investment return. This gives the excess return.
Then divide that excess return by the investment's standard deviation.
Sharpe Ratio Formula
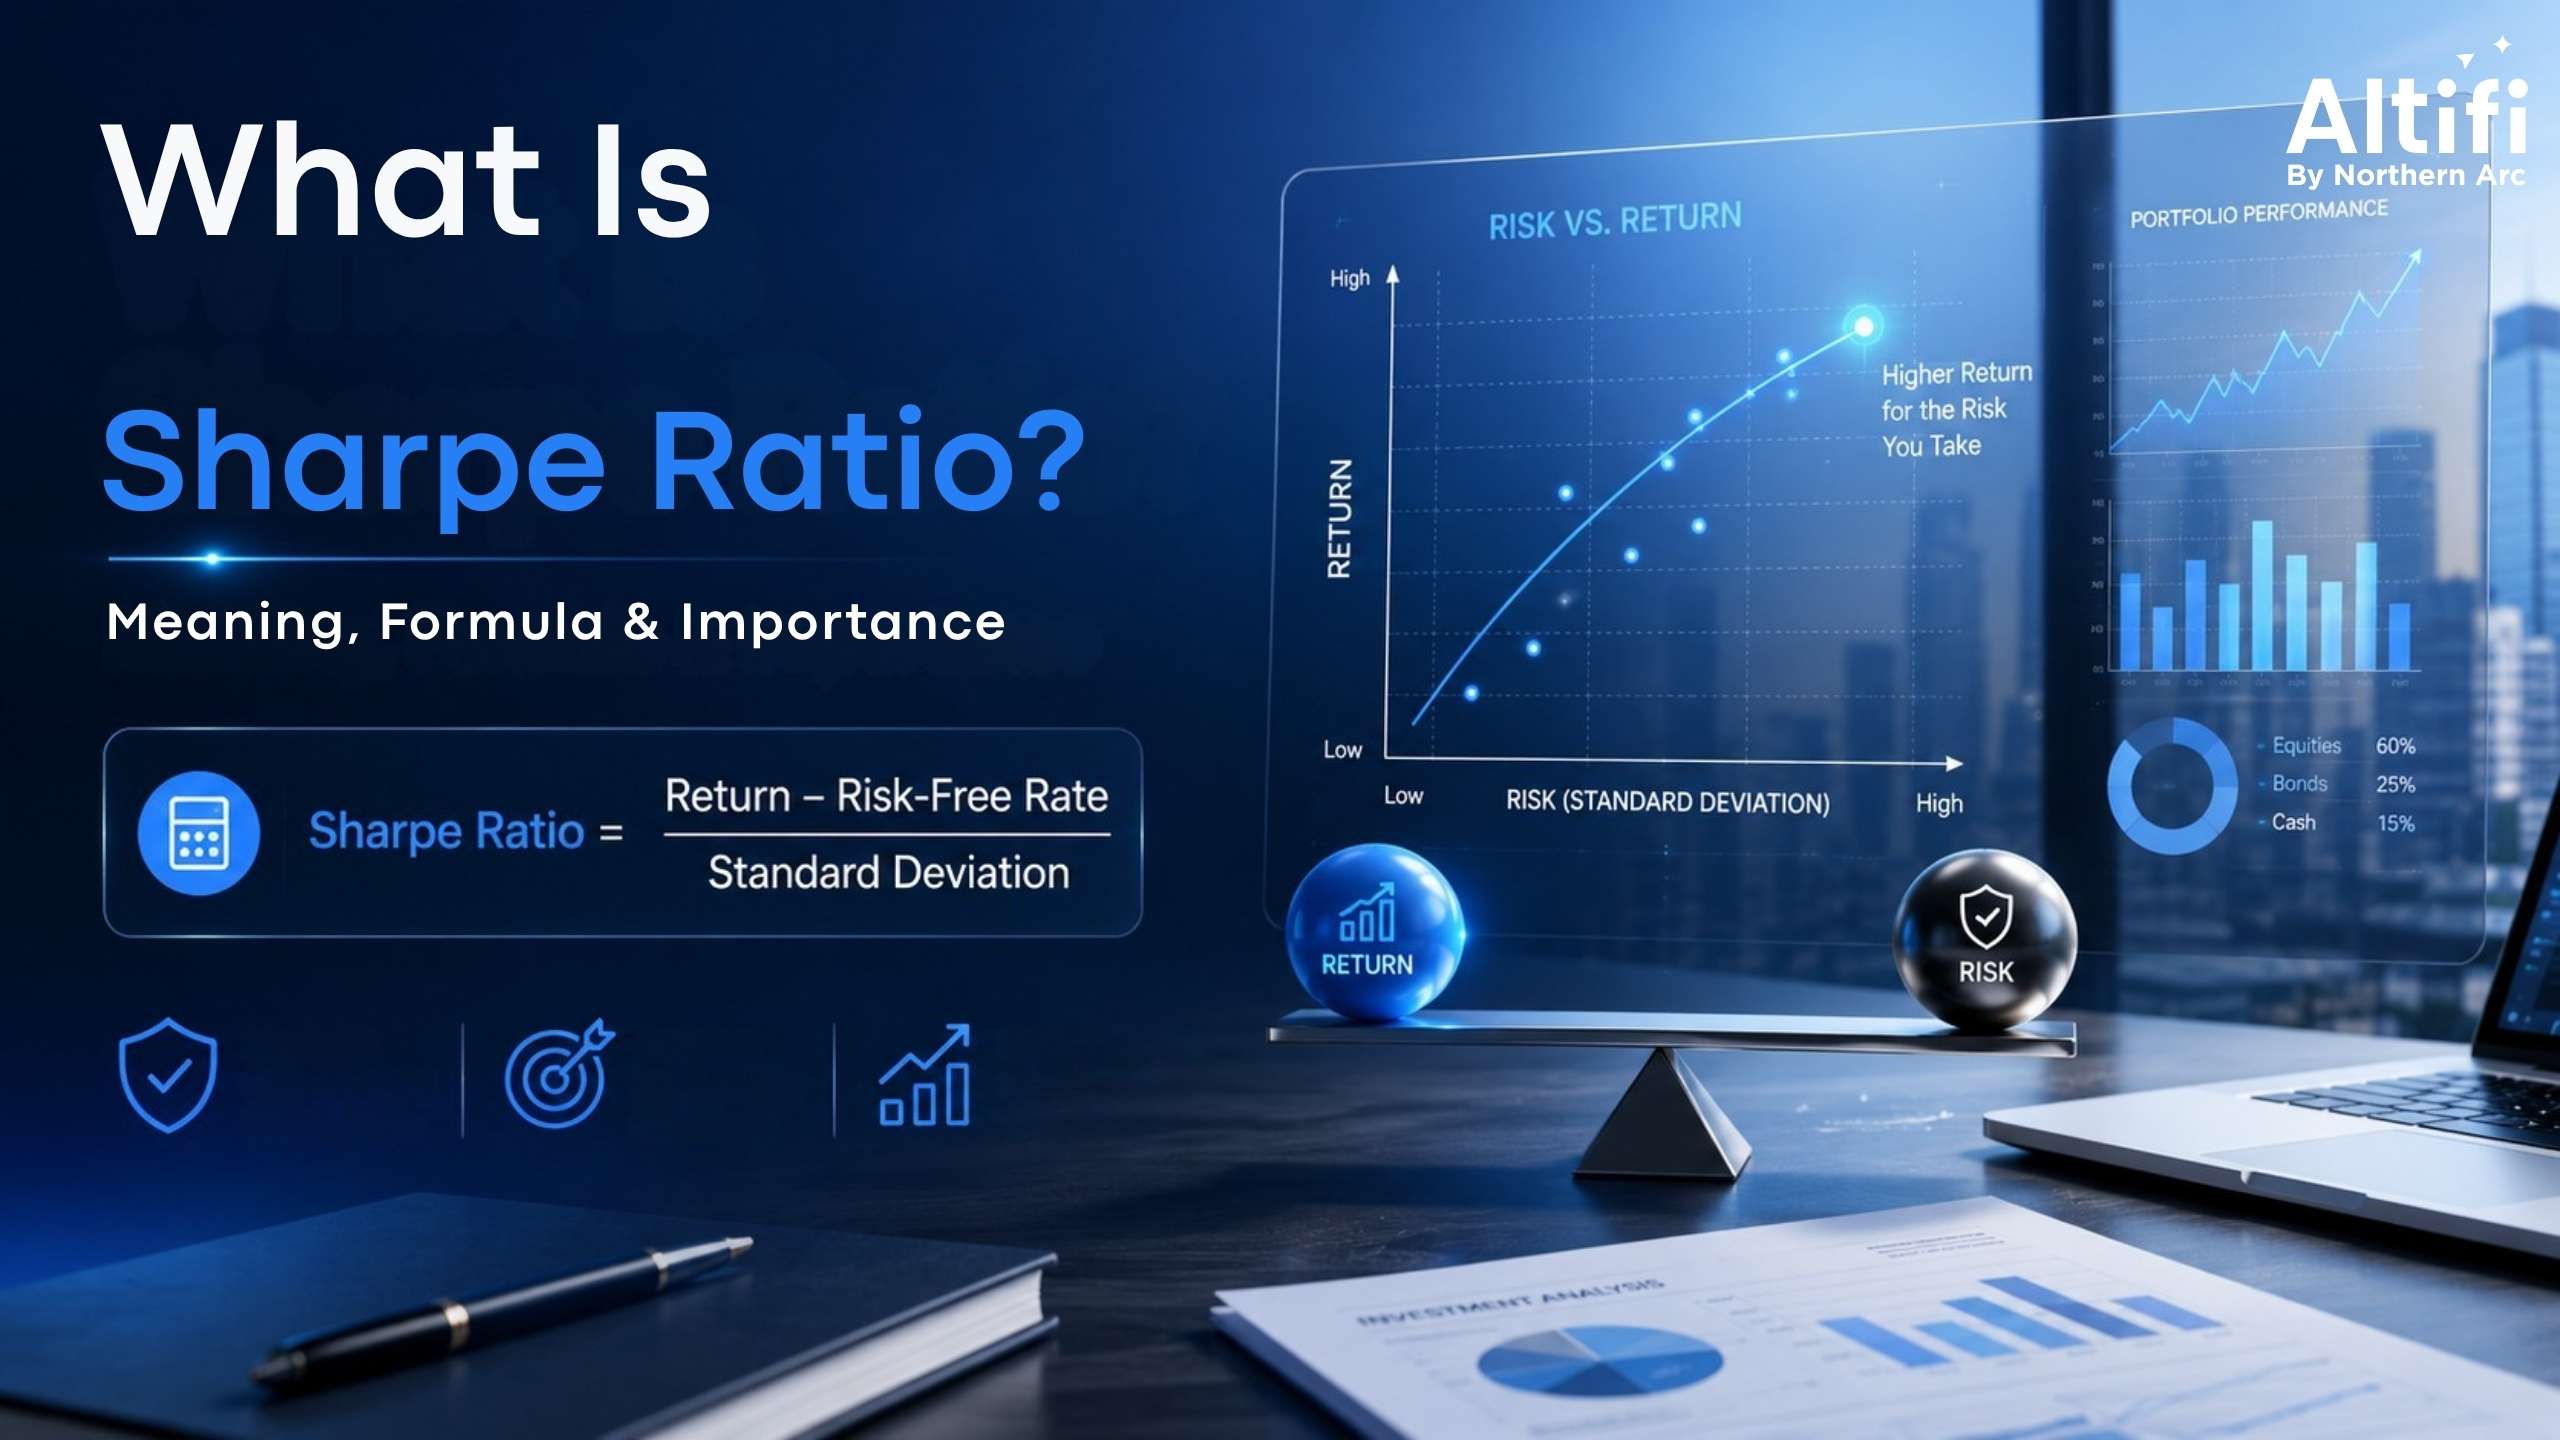
Sharpe Ratio = (Portfolio Return − Risk-Free Rate) ÷ Standard Deviation
For example, if a fund earns 12%, the risk-free rate is 6% and its standard deviation is 8%:
Sharpe Ratio = (12% − 6%) ÷ 8%
= 6% ÷ 8%
= 0.75
Sharpe Ratio Calculation: Worked Example
Suppose you are comparing a mutual fund with the following figures:
Particulars | Value |
Mutual fund return | 14% |
Risk-free rate | 6% |
Standard deviation | 10% |
Excess return | 8% |
Sharpe ratio | 0.80 |
The calculation is:
Sharpe Ratio = (14% − 6%) ÷ 10% = 0.80
The result means the fund generated 0.80 units of excess return for every unit of volatility assumed.
The number becomes more useful when compared with another fund with a similar objective.
How to Interpret the Sharpe Ratio
There is no universal Sharpe ratio that makes a fund good or bad. Still, the following broad framework can help:
Sharpe Ratio | Broad Interpretation |
Negative | Return was below the risk-free rate |
0 | Return was equal to the risk-free rate |
Below 1 | Relatively low risk-adjusted return |
1–2 | Generally considered reasonable to strong |
Above 2 | Strong risk-adjusted performance |
Above 3 | Very strong, but worth examining carefully |
These are only broad reference points. The appropriate benchmark can vary across asset classes, market conditions and investment categories.
Why Is the Sharpe Ratio Important?
The Sharpe ratio can help investors look beyond absolute returns.
- Puts returns into context: A 15% return means something different when one fund is far more volatile than another.
- Helps compare investments: It can make risk-adjusted comparisons easier.
- Measures efficiency: It shows how much excess return was generated for each unit of volatility.
- Supports portfolio decisions: Investors can use it alongside other risk and performance measures.
- Highlights excessive volatility: A high-return investment may have a relatively low Sharpe ratio if its volatility is also high.
The main idea is simple: returns matter, but the risk taken to earn them matters too.
Sharpe Ratio in Mutual Fund Analysis
The Sharpe ratio is commonly used when analysing mutual funds.
Suppose Fund A delivered 13% over a particular period with a standard deviation of 8%. Fund B also delivered 13%, but its standard deviation was 12%. If both have the same risk-free rate, Fund A will have the higher Sharpe ratio.
That suggests Fund A generated the same return with less volatility.
When comparing mutual funds, however, it makes more sense to compare funds within the same category. Comparing an equity fund with a liquid fund using the same Sharpe benchmark would not provide much insight.
Sharpe Ratio Benchmarks Across Mutual Fund Categories
Sharpe ratios can vary considerably across fund categories because different investments naturally carry different levels of risk.
Fund Category | Typical Risk Level | How Sharpe Ratio Can Help |
Equity funds | High | Compare risk-adjusted equity performance |
Hybrid funds | Moderate to high | Assess returns relative to portfolio volatility |
Debt funds | Low to moderate | Compare risk-adjusted returns within similar categories |
Liquid funds | Relatively low | Examine whether returns justify the volatility taken |
There is no fixed "good" Sharpe ratio for each category. The most useful comparison is usually between funds with similar investment objectives and risk profiles.
How Does Standard Deviation Affect the Sharpe Ratio?
Standard deviation shows how much the returns of an asset vary from its average return.
As it is used in the denominator of the Sharpe ratio formula, a larger standard deviation decreases the Sharpe ratio if the excess return does not change.
For example:
Fund A: 12% return, 6% risk-free rate and 6% standard deviation
Sharpe Ratio = (12% − 6%) ÷ 6% = 1
Now assume Fund B earns the same 12%, but its standard deviation is 12%.
Sharpe Ratio = (12% − 6%) ÷ 12% = 0.5
Both funds earned 12%, but Fund A generated that return with lower volatility.
Limitations of the Sharpe Ratio
The Sharpe ratio is useful, but it has some limitations:
- Uses historical data: Past risk-adjusted performance doesn't guarantee future results.
- Treats all volatility as risk: Positive and negative movements are both included.
- Depends on the measurement period: Different periods can produce very different ratios.
- Can be distorted by unusual returns: One-off events may affect the calculation.
- Less useful across unrelated categories: Comparing fundamentally different funds can be misleading.
- Doesn't explain the source of returns: A high ratio doesn't tell you which investments generated the performance.
How to Use the Sharpe Ratio When Comparing Mutual Funds
Start by comparing funds with similar investment objectives.
Then look at their Sharpe ratios over the same period. A higher ratio may indicate better risk-adjusted performance, but don't stop there.
Check the fund's returns, standard deviation, drawdowns, expense ratio, portfolio composition and consistency as well.
It is also worth checking whether the fund's current strategy is similar to the one that produced its historical Sharpe ratio.
The goal isn't to find the fund with the highest number. It is to understand whether the returns justify the risk taken.
Conclusion
The Sharpe ratio gives investors a simple way to connect returns with risk. A fund that delivers strong returns with relatively low volatility will generally have a better Sharpe ratio than one that takes much larger swings to produce similar returns. But the number shouldn't be treated as a standalone scorecard. Market conditions, investment category, time period and portfolio strategy all matter. Used alongside other performance and risk measures, the Sharpe ratio can help you make more meaningful mutual fund comparisons.
Frequently Asked Questions (FAQs)
What is a good Sharpe ratio?
A Sharpe ratio above 1 is often viewed positively, while higher values indicate stronger risk-adjusted performance. However, comparisons should be made within similar fund categories.
Can a Sharpe ratio be negative?
Yes. A negative Sharpe ratio means the investment's return was below the risk-free rate over the period measured.
What does a Sharpe ratio of 1 mean?
A Sharpe ratio of 1 means the investment generated one unit of excess return for every unit of volatility.
How do I calculate the Sharpe ratio?
Use the formula: (Portfolio Return − Risk-Free Rate) ÷ Standard Deviation.
What is the difference between the Sharpe ratio and the Treynor ratio?
The Sharpe ratio uses total volatility, measured through standard deviation. The Treynor ratio uses beta, which measures an investment's sensitivity to overall market movements.
What is the Sharpe ratio in mutual funds?
It measures how much excess return a mutual fund generated relative to its volatility. It can help investors compare risk-adjusted performance among similar funds.
What if the Sharpe ratio is 0?
A Sharpe ratio of zero means the investment's return was equal to the risk-free rate over the measurement period.
Why is a higher Sharpe ratio better?
A higher Sharpe ratio generally means the investment generated more excess return for each unit of volatility. This can indicate better risk-adjusted performance.
Disclaimer:
The information contained in this Article (“Article”) is for general informational purposes only. Northern Arc Capital Limited (“Northern Arc”) does not make any warranties about the completeness, reliability, and accuracy of this information. Any action you take upon the information contained in this Article is strictly at your own risk, and Northern Arc will not be liable for any losses and damages in connection with the use of our Article.
The data included in this Article has been obtained from sources that are believed to be reliable and accurate at the time of publication. However, Northern Arc does not guarantee the accuracy or completeness of any information, nor does it assume any responsibility or liability for any errors or omissions therein. Any opinions expressed herein are subject to change without notice and Northern Arc is under no obligation to update or keep current the information contained in this Article.
This Article is not intended to constitute, and should not be construed as, investment advice or a recommendation to purchase, sell, or hold any security or to engage in any investment strategy or transaction. Readers should not rely solely on the information provided in this Article for making investment decisions and should conduct their own due diligence or seek the advice of a qualified professional.
The content of this Article is for informational purposes only and is not a solicitation or an offer to buy or sell any securities or financial instruments. Northern Arc is not responsible for any investment decisions made by the recipients of this Article. Readers should take independent financial advice from a qualified professional in connection with, or independently research and verify, any information that is provided in this Article and wish to rely upon, whether for the purpose of making an investment decision or otherwise.
Northern Arc and its affiliates, directors, employees, and agents expressly disclaim any and all liability for any direct or indirect losses, damages, or expenses of any kind arising out of or relating to the use of this Article, including but not limited to, any losses related to the accuracy, completeness, timeliness, or reliability of such information.
This Article may contain forward-looking statements that are based on current expectations, estimates, forecasts, and projections about the markets in which Northern Arc operates, as well as management’s beliefs and assumptions. Forward-looking statements are not guarantees of future performance and involve certain risks and uncertainties, which are difficult to predict. Past performance is not indicative of future results.
This report is intended solely for the recipient and is not for further circulation. Any distribution, modification, reproduction, or disclosure of the contents of this Article, in whole or in part, without the prior written consent of Northern Arc, is strictly prohibited.