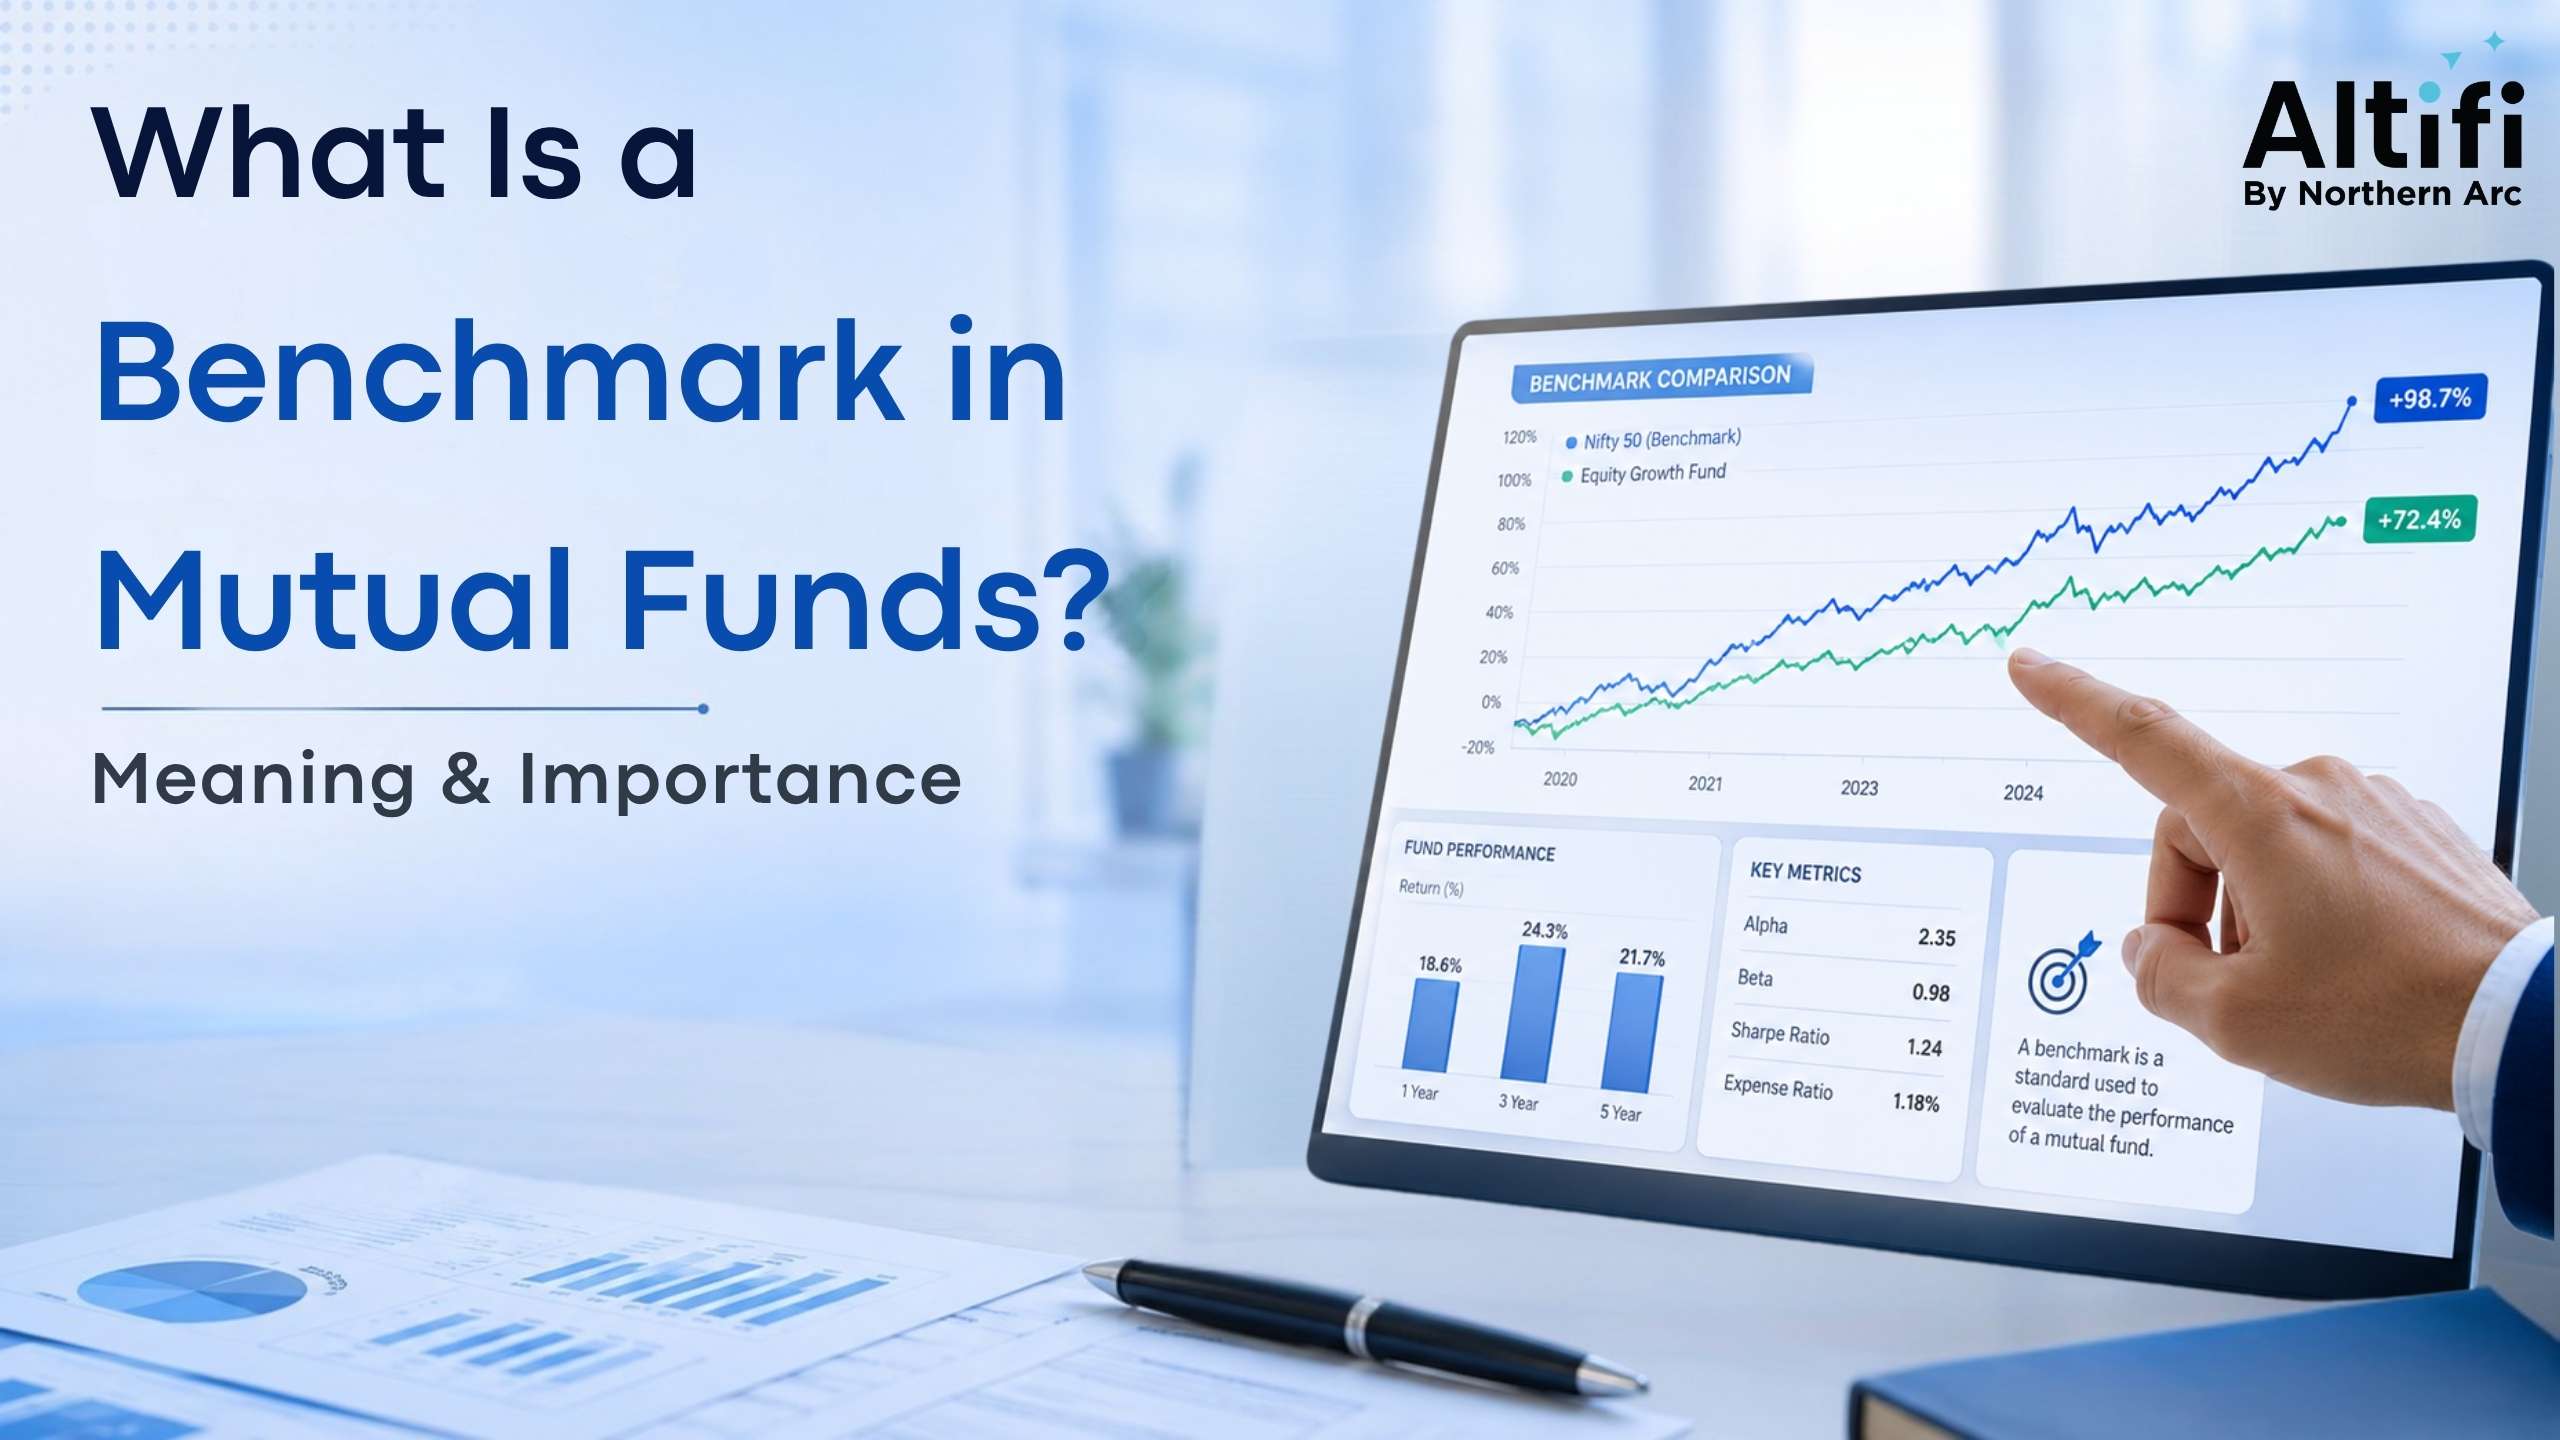
A mutual fund benchmark is an index used as a reference point to evaluate the performance of a mutual fund scheme. The performance of the mutual fund can be measured by comparing it to the returns made from the index. When a large-cap equity fund is benchmarked with the Nifty 50, we get to know whether our fund manager was able to generate any alpha or not.
Since 2018, Indian regulations require this comparison to be fair and standardised, which is where the Total Return Index (TRI) comes in.
How Does Benchmarking Work in Mutual Funds?
Benchmarking functions through monitoring a specified basket of stocks that constitutes an index within a market sector. The performance of the fund over a given period, whether one year, three years, or five years, is then compared with the performance of the benchmark during the same period of time.
Thus, in the case where a large-cap fund performs 14% in a given year and its benchmark, the Nifty 50 Total Return Index (TRI), 12%, it can be said that the fund has "outperformed its benchmark" by 2%. This difference of 2% is known as the alpha.
The 1.2% difference per year in the use of TRI and Price Return Index (PRI) may seem insignificant, but compounded over 15 to 20 years, it represents a significant part of the total returns earned.
Types of Benchmarks Used by Mutual Funds
Here are the different types of benchmarks mutual funds use.
Type | Description |
Broad Market Index | Represents overall market movement (e.g., Nifty 50, Sensex) |
Sectoral Index | Tracks a specific sector (e.g., Nifty Bank, Nifty IT) |
Category-Specific Index | Matches a fund's category, like Nifty Midcap 150 for midcap funds |
Strategy Index | Tracks a specific investing style, such as Nifty200 Value 30 |
Custom/Composite Benchmark | A blend of indices, common for hybrid or multi-asset funds |
SEBI has introduced a two-tiered structure for benchmarking of schemes: the first-tier benchmark reflects the scheme's category, while the second-tier benchmark demonstrates the fund manager's investment style or strategy within that category.
Common Mutual Fund Benchmarks and Their Uses
Here are some common mutual funds benchmarks often used.
Fund Category | Common Benchmark |
Large-Cap Equity | Nifty 50 TRI / BSE Sensex TRI |
Mid-Cap Equity | Nifty Midcap 150 TRI |
Small-Cap Equity | Nifty Smallcap 250 TRI |
Flexi-Cap/Multi-Cap | Nifty 500 TRI |
Banking Sector Fund | Nifty Bank TRI |
Debt Fund | CRISIL Composite Bond Index |
Hybrid Fund | Blended equity-debt index (e.g., CRISIL Hybrid 35+65) |
Why Do Mutual Funds Use Benchmarks?
Benchmarks serve several practical purposes for Indian investors:
1. Performance evaluation:
They show whether a fund manager's active decisions are adding value over a passive market investment.
2. Regulatory transparency:
SEBI mandates benchmark disclosure in every scheme's factsheet, making comparisons standard across the industry.
3. Risk context:
A benchmark reflects the natural risk-return profile of a category, helping investors set realistic expectations.
4. Fund selection:
Comparing multiple funds against the same benchmark helps investors shortlist better performers within a category.
What is Benchmark Outperformance and Underperformance?
Outperformance occurs when a fund's returns exceed its benchmark's returns over a given period; underperformance is the opposite.
For instance, the Nifty 50 (Price Return variant) closed at 23,865.75 on June 30, 2026, up 1.35% during the month, while the Nifty 50 Total Return Index increased by 1.67% over the same period. If an actively managed large-cap fund grew by only 1.2% in that month, it would be classified as underperforming its TRI benchmark, even though it may have outperformed the price-only index. This is exactly why using TRI, not PRI, is critical for a fair comparison.
Over longer horizons, the Nifty 50 TRI delivered an annualised return of about 12.44% over the 20 years ending February 27, 2026. A fund consistently trailing this figure over a comparable period would be considered a long-term underperformer relative to its category benchmark.
How Alpha, Beta and Sharpe Ratio Relate to Benchmarking
Alpha, beta and sharpe are key ratios for analysing performance of various securities. Let’s look at what they tell us about benchmarking.
Metric | What It Measures | Relation to Benchmark |
Alpha | Excess return over the benchmark | Positive alpha = outperformance |
Beta | Fund's sensitivity to benchmark movements | Beta > 1 means higher volatility than benchmark |
Sharpe Ratio | Risk-adjusted return | Higher Sharpe Ratio indicates better excess return per unit of risk |
These three metrics work together with the benchmark to give a fuller picture, a fund could show a higher return but also higher risk, and Sharpe ratio helps normalise that comparison.
Benefits and Limitations of Benchmarking
The pros and cons of benchmarking are as follows.
Benefits:
- Provides an objective, standardised measure of fund performance
- Helps investors avoid funds that consistently lag their category
- Encourages transparency and accountability from fund houses
- Assists in setting realistic long-term return expectations
Limitations:
- A mismatched benchmark (e.g., comparing a multi-cap fund to a pure large-cap index) can mislead investors
- Short-term over/underperformance may not reflect a fund's true long-term skill
- Some funds may selectively choose "easier" benchmarks to appear favourable
- Benchmark returns don't account for a fund's expense ratio or exit load impact on investor returns
Conclusion
Benchmarks are not mere numbers mentioned on a factsheet; benchmarks are the criteria by which each rupee of your mutual fund investments will be measured. With the implementation of the TRI regime and the two-tiered approach to benchmarks by SEBI, Indian investors have the most powerful means of analysis ever before to assess if their fund managers are indeed adding value to their portfolios. The next time you invest, ensure that you know your benchmark mentioned in the scheme documents and how it compares to your fund's TRI performance.
FAQs on Benchmark in Mutual Funds
How does SEBI's TRI mandate affect my mutual fund's benchmark?
SEBI's circular dated 4 January 2018 mandated that every scheme benchmark against the Total Return Index instead of the Price Return Index. This means the benchmark figure you see in your fund factsheet already includes reinvested dividends, giving a more realistic comparison than price movement alone.
What is benchmark error and how does it affect returns?
When an incorrect index is taken to evaluate the performance of a fund then it creates benchmark error like benchmarking of a mid cap fund to a large cap index. It creates confusion whether the fund is over performing or not based on its correct investment universe.
How do I know if my mutual fund is outperforming its benchmark?
The factsheet of any mutual fund tells about the return of the fund and its respective benchmark TRI return. You have to match the two data in 1-year, 3-year, and 5-year periods.
What is the best benchmark for large-cap or equity mutual funds?
Nifty 50 TRI and BSE Sensex TRI are the two most popular benchmarks for India's top companies of large cap equity funds.
Can a mutual fund change its benchmark, and what does that mean for investors?
Yes, the fund house has the freedom to change the benchmark of a scheme according to its category mapping norms of SEBI.
What is benchmark in mutual fund?
It is a market index used as a standard to measure and compare a mutual fund scheme's performance over a chosen time period.
How to measure mutual fund performance against benchmark?
Evaluate the fund performance using the return on CAGR/absolute terms with that of benchmark's TRI and also take into account the risk measures of alpha, beta, and Sharpe ratio.
Disclaimer:
The information contained in this Article (“Article”) is for general informational purposes only. Northern Arc Capital Limited (“Northern Arc”) does not make any warranties about the completeness, reliability, and accuracy of this information. Any action you take upon the information contained in this Article is strictly at your own risk, and Northern Arc will not be liable for any losses and damages in connection with the use of our Article.
The data included in this Article has been obtained from sources that are believed to be reliable and accurate at the time of publication. However, Northern Arc does not guarantee the accuracy or completeness of any information, nor does it assume any responsibility or liability for any errors or omissions therein. Any opinions expressed herein are subject to change without notice and Northern Arc is under no obligation to update or keep current the information contained in this Article.
This Article is not intended to constitute, and should not be construed as, investment advice or a recommendation to purchase, sell, or hold any security or to engage in any investment strategy or transaction. Readers should not rely solely on the information provided in this Article for making investment decisions and should conduct their own due diligence or seek the advice of a qualified professional.
The content of this Article is for informational purposes only and is not a solicitation or an offer to buy or sell any securities or financial instruments. Northern Arc is not responsible for any investment decisions made by the recipients of this Article. Readers should take independent financial advice from a qualified professional in connection with, or independently research and verify, any information that is provided in this Article and wish to rely upon, whether for the purpose of making an investment decision or otherwise.
Northern Arc and its affiliates, directors, employees, and agents expressly disclaim any and all liability for any direct or indirect losses, damages, or expenses of any kind arising out of or relating to the use of this Article, including but not limited to, any losses related to the accuracy, completeness, timeliness, or reliability of such information.
This Article may contain forward-looking statements that are based on current expectations, estimates, forecasts, and projections about the markets in which Northern Arc operates, as well as management’s beliefs and assumptions. Forward-looking statements are not guarantees of future performance and involve certain risks and uncertainties, which are difficult to predict. Past performance is not indicative of future results.
This report is intended solely for the recipient and is not for further circulation. Any distribution, modification, reproduction, or disclosure of the contents of this Article, in whole or in part, without the prior written consent of Northern Arc, is strictly prohibited.