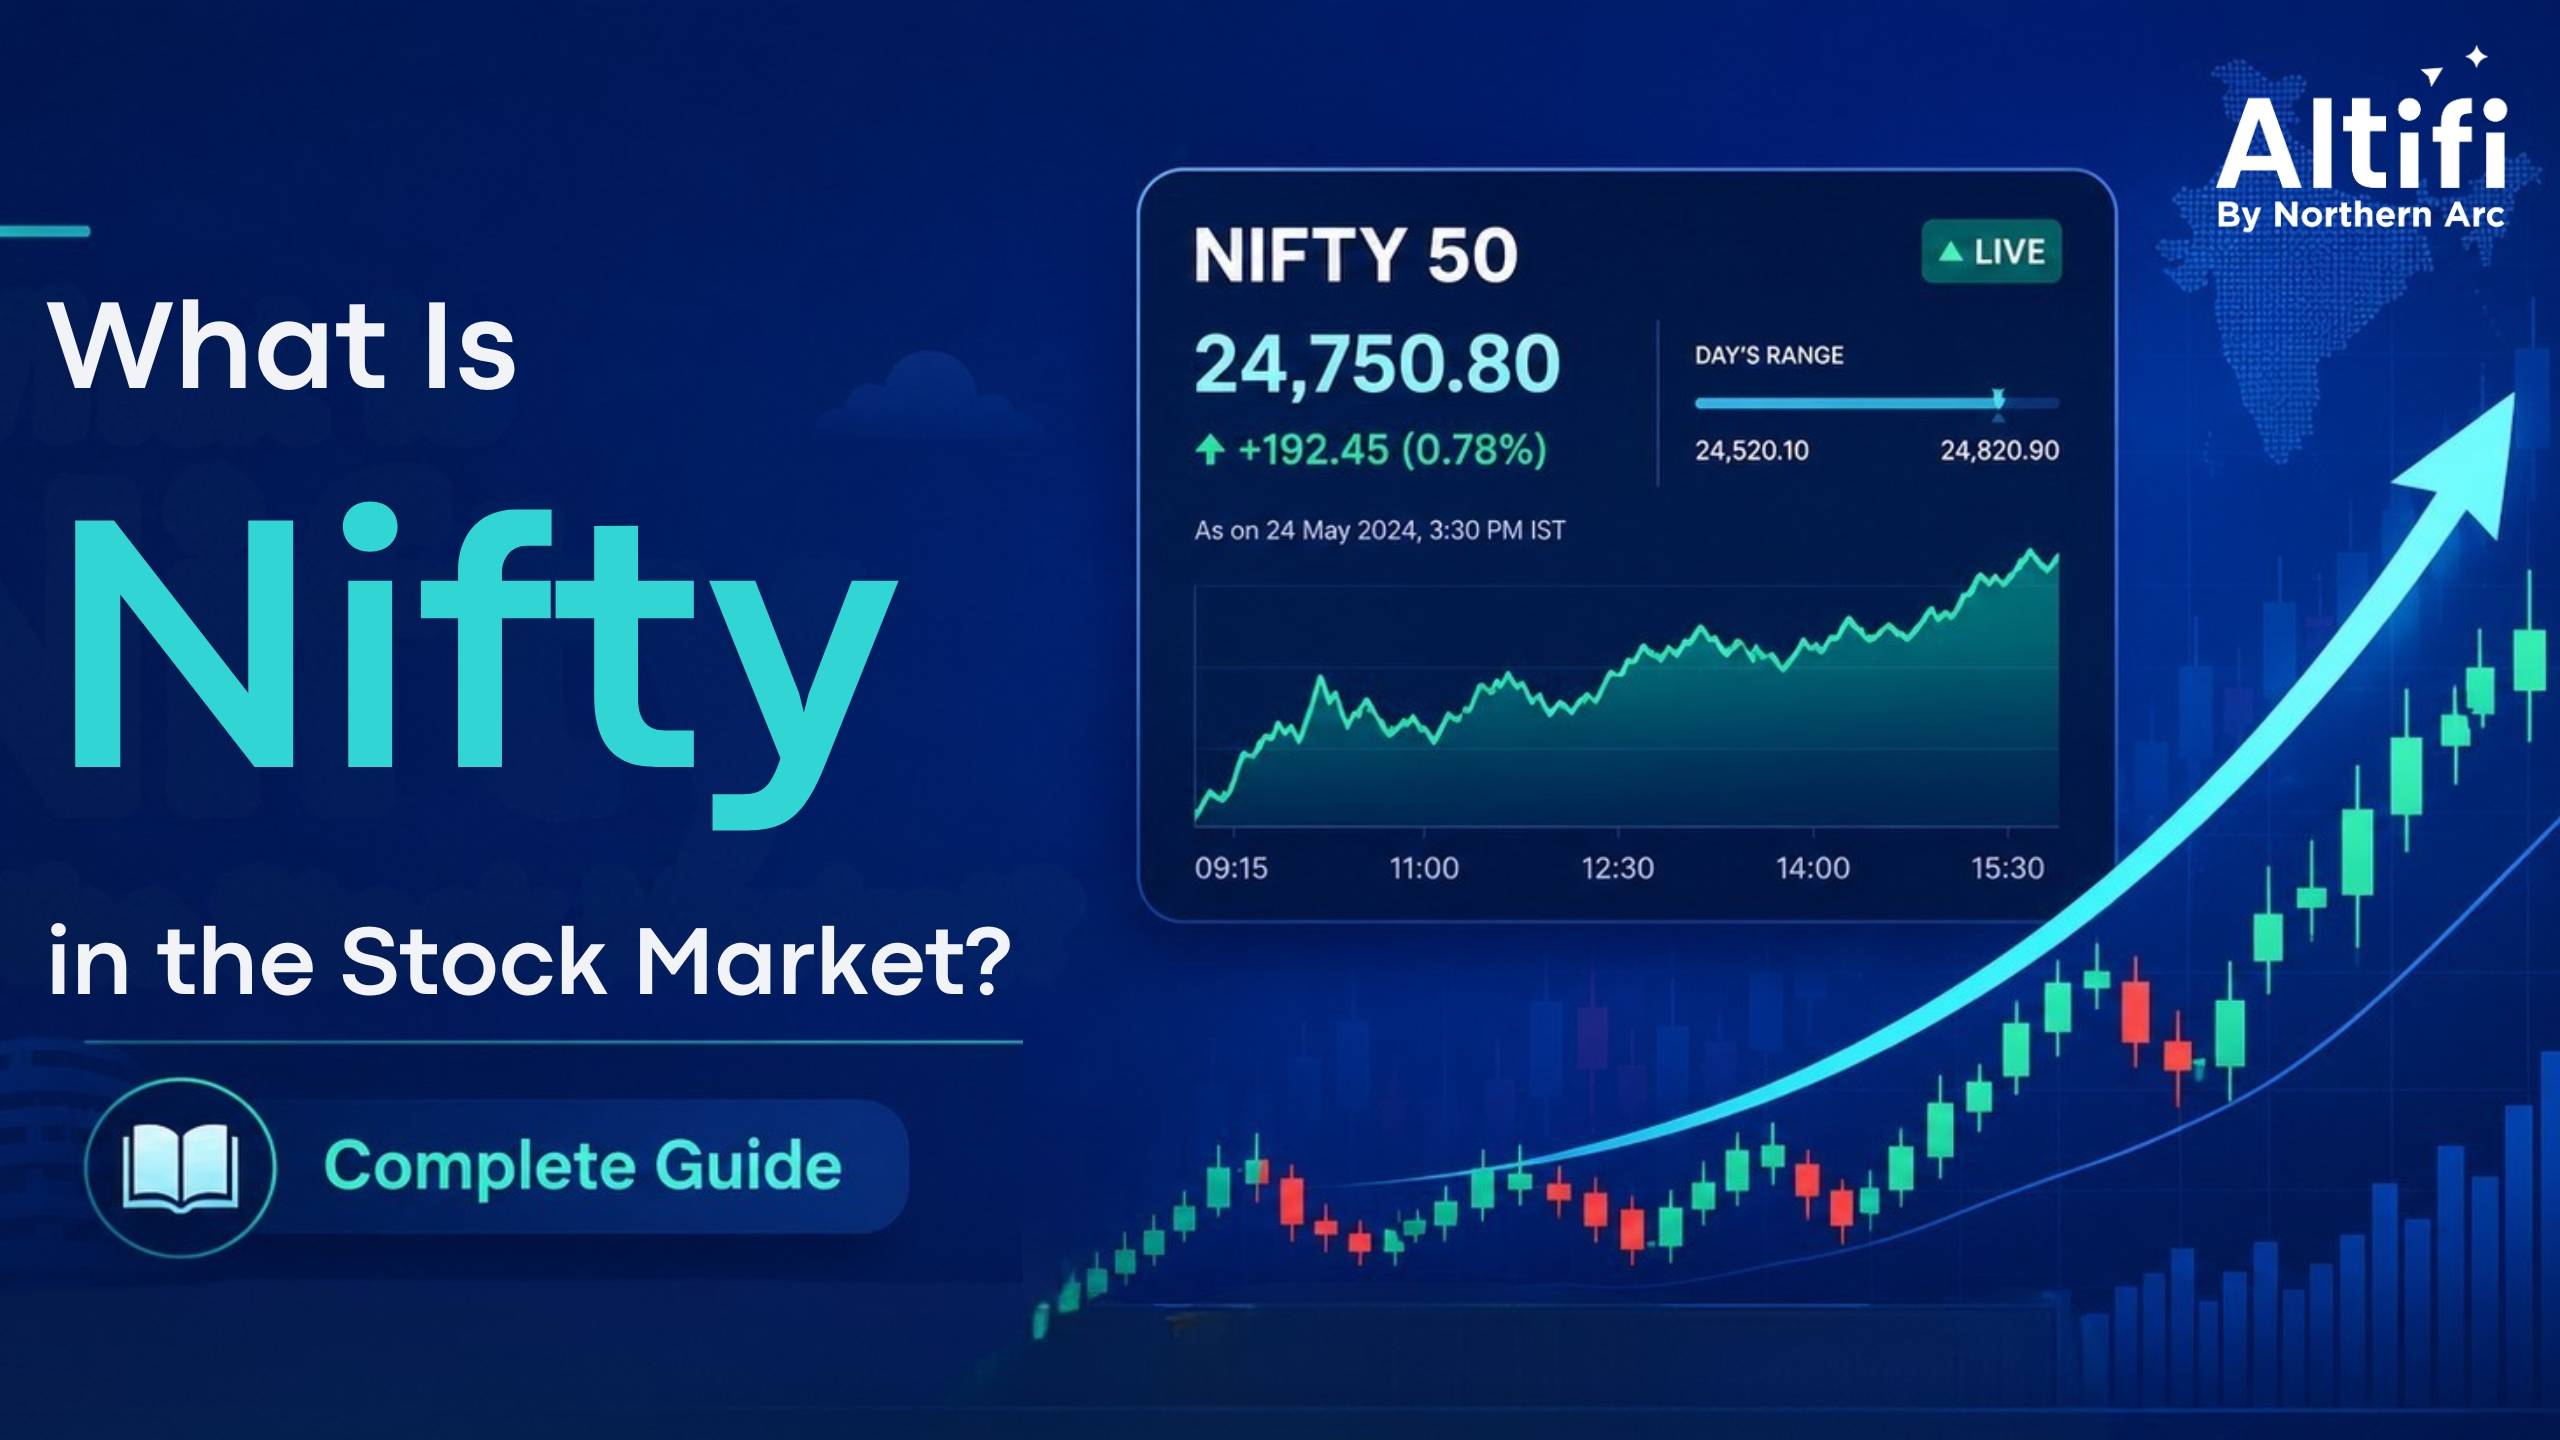
The NIFTY 50 is an index of the Indian stock market which includes the stocks of 50 large, liquid companies listed on the NSE. The index was introduced on 21 April 1996 and has the base date of 3 November 1995, at which time its base level was set to 1,000. Any increase or decrease in the Nifty Index reflects changes in investor sentiments about India's leading companies.
Types of NIFTY Indices
Besides the main NIFTY 50, NSE Indices Limited runs several sub-indices that track specific sectors or market segments.
NIFTY Bank
Also called Bank Nifty, this tracks the 12 most liquid, large-cap banking stocks on the NSE. It's widely used as a benchmark for the banking sector and is one of the most actively traded indices in India's derivatives market.
NIFTY IT
Tracks the leading information technology companies listed on the NSE. It's closely watched given IT's large share of India's export economy.
NIFTY Next 50
Covers the 50 companies ranked just below the NIFTY 50 by market capitalisation. It's popular with investors looking for the next generation of large-cap stocks.
NIFTY Financial Services
Banks, NBFCs, insurance, and other financial companies – a larger selection than the NIFTY Bank index alone.
NIFTY Midcap 50
Consists of medium-sized companies based on market cap, thus diversifying from the largest companies.
Every sub-index has its own objective – futures and options traders keep an eye on NIFTY Bank, whereas long-term investors might consider NIFTY Next 50.
Who Owns and Manages NIFTY 50?
NIFTY 50 is owned and managed by NSE Indices Limited, formerly known as India Index Services & Products (IISL). This company decides which stocks qualify for the index, reviews the composition regularly, and maintains the official methodology.
Not every NSE-listed company qualifies. To be included, a stock must meet strict rules:
Domicile and listing
The company must be domiciled in India and listed on the NSE. Foreign companies listed via Indian Depository Receipts don't qualify.
Free-float market capitalisation
The stock must rank among the largest by free-float market cap, the value of shares actually available for public trading, excluding promoter holdings.
Liquidity
The stock must have an average impact cost of 0.50% or less for 90% of trading days over the past six months, for a ₹10 crore portfolio. Impact cost measures how much price moves when a large order is placed.
Trading frequency
The stock must have traded on at least 90% of trading days in the past six months.
Listing history
A minimum of six months' listing history is required, though a three-month track record may be accepted for strong IPOs.
Stocks that stop meeting these criteria can be dropped in future reviews.
History and Evolution of NIFTY 50
NIFTY was launched on 21 April 1996 and has grown alongside the Indian economy over three decades, weathering multiple market crashes and recoveries along the way.
Key milestones:
Year | Milestone |
1996 | NIFTY 50 launched at ~1,000 |
2000 | Crossed 1,500 during the dot-com boom |
2004 | Crossed 2,000 amid economic growth |
2007 | Peaked above 6,100 before the global financial crisis |
2008 | Fell sharply to around 2,500 during the financial crisis |
2014 | Crossed 8,000 after a change in government |
2017 | Crossed 10,000 for the first time |
2020 | Fell below 8,000 during the COVID-19 crash, then recovered |
2021 | Crossed 18,000 in the post-pandemic recovery |
2023 | Crossed 20,000 |
2024 | Touched around 26,000 |
It has seen a fall of about 60% during the 2008 crisis period and once again in March 2020. It shows that even though NIFTY has seen strong growth in its long-term performance, it is also subject to short-term falls.
How is the NIFTY 50 Index Calculated?
NIFTY uses a free-float market capitalisation-weighted method. This means larger companies with more publicly available shares influence the index more than smaller ones.
Formula:
Index Value = (Current Market Value of all 50 stocks ÷ Base Market Capital) × 1,000
Steps:
- Calculate the free-float market cap of each of the 50 stocks (share price × shares available for public trading, excluding promoter holdings).
- Add these values to get the total current market value.
- Divide by the base market capital, the total free-float market cap of these stocks on 3 November 1995.
- Multiply by 1,000 (the base index value) to get the current NIFTY level.
Since it is a weighted formula, a larger corporation such as Reliance Industries would have a much greater effect on the index than a smaller company even if there is an equal percentage increase or decrease. The market capital base figure is also revised in light of any corporate activities like stock split, bonus shares issue, etc.
NSE Indices Limited reviews the index composition twice a year - in March and September. Underperforming stocks may be replaced by ones that better meet the eligibility criteria. When a stock is added, index funds must buy it, which can push its price up temporarily; the opposite happens when a stock is removed. Removal doesn't necessarily mean the company is a bad investment - it simply no longer meets the index's current thresholds.
Why is NIFTY 50 Important?
Benchmark for mutual funds
Most equity mutual fund performance is measured against NIFTY 50. If a fund returns more than NIFTY, it has "beaten the market."
Basis for index funds and ETFs
Many low-cost passive investment products directly replicate NIFTY 50's composition.
Indicator of economic health
While it covers only 50 companies, they span multiple sectors and represent a large share of total market value, making NIFTY a useful metric of economic momentum.
Drives derivatives markets
NIFTY futures and options are among the most heavily traded contracts globally, influencing prices even for investors who don't trade derivatives directly.
What Factors Affect NIFTY 50?
Here are some major factors that affect NIFTY 50:
Sector weights
Being heavily influenced by the financial services sector and the IT sector, any changes in their performance will greatly impact NIFTY.
Quarterly earnings
Quarterly performance and results of the leading companies listed in the index will directly influence NIFTY.
Global market conditions
Changes in the market conditions in the USA and other countries may influence the sentiments of Indian investors.
Monetary policy and interest rate movements
Decisions made by the Reserve Bank of India, data on inflation, etc. influence the sentiments of investors.
Inflows/withdrawals of foreign institutional investors
Heavy inflow/withdrawal of investments by FIIs will influence NIFTY.
Global events and crisis
Global events, such as the global economic crisis of 2008 or COVID-19, have triggered sudden movements in the index.
How to Invest in NIFTY 50?
You cannot buy the NIFTY 50 index directly, but you can gain exposure through the following steps:
Open a Demat and trading account with a registered broker.
Select your path
Buy into a NIFTY 50 index fund/ETF for diversification and minimal costs, or choose individual stocks in the index.
Systematic Investment Plan (optional)
If investing through a mutual fund, the Systematic Investment Plan allows regular investment, where you buy more units if the index drops and fewer units if the index goes up.
Periodic monitoring
Monitor the performance of the index and continue to invest in both up and down markets.
Conclusion
Getting an understanding of how NIFTY 50 operates and the factors that affect the calculation of this index can help you get insights into why the markets behave the way they do. NIFTY 50 is more than just a number; it is a reflection of the performance of 50 best-performing Indian-listed companies involved in sectors like banking, IT, energy and many others. It has witnessed good growth through the years, but there have been times when it has faced volatility.
FAQs on Nifty 50
What is NIFTY 50?
NIFTY 50 is a benchmark stock index in India, measuring the weighted average of the 50 largest stocks listed on NSE. NIFTY 50 was launched in April 1996 with the base of 1,000.
How is NIFTY 50 calculated?
Free-float market capitalisation weighted methodology: current total free-float market cap of all 50 stocks, divided by base market capital, multiplied by 1,000. Base period is 3 November 1995.
What is the difference between NIFTY and Sensex?
NIFTY 50 measures performance of 50 stocks from NSE while Sensex measures performance of 30 stocks from BSE. Both indices apply free-float market cap methodology, but NIFTY covers more sectors than Sensex. These two usually follow the same trend as they consist of common companies.
How to invest in NIFTY 50 stocks?
Register a Demat and trading account, and invest either in NIFTY 50 index fund, in an ETF or in individual constituents.
What is NIFTY Bank?
A sub-index tracking the 12 most liquid, large-cap banking stocks on the NSE. It's a key benchmark for the banking sector and one of the most actively traded indices in India's derivatives market.
Disclaimer:
The information contained in this newsletter (“Newsletter”) is for general informational purposes only. Northern Arc Capital Limited (“Northern Arc”) does not make any warranties about the completeness, reliability, and accuracy of this information. Any action you take upon the information contained in this Newsletter is strictly at your own risk, and Northern Arc will not be liable for any losses and damages in connection with the use of our Newsletter.
The data included in this Newsletter has been obtained from sources that are believed to be reliable and accurate at the time of publication. However, Northern Arc does not guarantee the accuracy or completeness of any information, nor does it assume any responsibility or liability for any errors or omissions therein. Any opinions expressed herein are subject to change without notice and Northern Arc is under no obligation to update or keep current the information contained in this Newsletter.
This Newsletter is not intended to constitute, and should not be construed as, investment advice or a recommendation to purchase, sell, or hold any security or to engage in any investment strategy or transaction. Readers should not rely solely on the information provided in this Newsletter for making investment decisions and should conduct their own due diligence or seek the advice of a qualified professional.
The content of this Newsletter is for informational purposes only and is not a solicitation or an offer to buy or sell any securities or financial instruments. Northern Arc is not responsible for any investment decisions made by the recipients of this Newsletter. Readers should take independent financial advice from a qualified professional in connection with, or independently research and verify, any information that is provided in this Newsletter and wish to rely upon, whether for the purpose of making an investment decision or otherwise.
Northern Arc and its affiliates, directors, employees, and agents expressly disclaim any and all liability for any direct or indirect losses, damages, or expenses of any kind arising out of or relating to the use of this Newsletter, including but not limited to, any losses related to the accuracy, completeness, timeliness, or reliability of such information.
This Newsletter may contain forward-looking statements that are based on current expectations, estimates, forecasts, and projections about the markets in which Northern Arc operates, as well as management’s beliefs and assumptions. Forward-looking statements are not guarantees of future performance and involve certain risks and uncertainties, which are difficult to predict. Past performance is not indicative of future results.
This report is intended solely for the recipient and is not for further circulation. Any distribution, modification, reproduction, or disclosure of the contents of this Newsletter, in whole or in part, without the prior written consent of Northern Arc, is strictly prohibited.