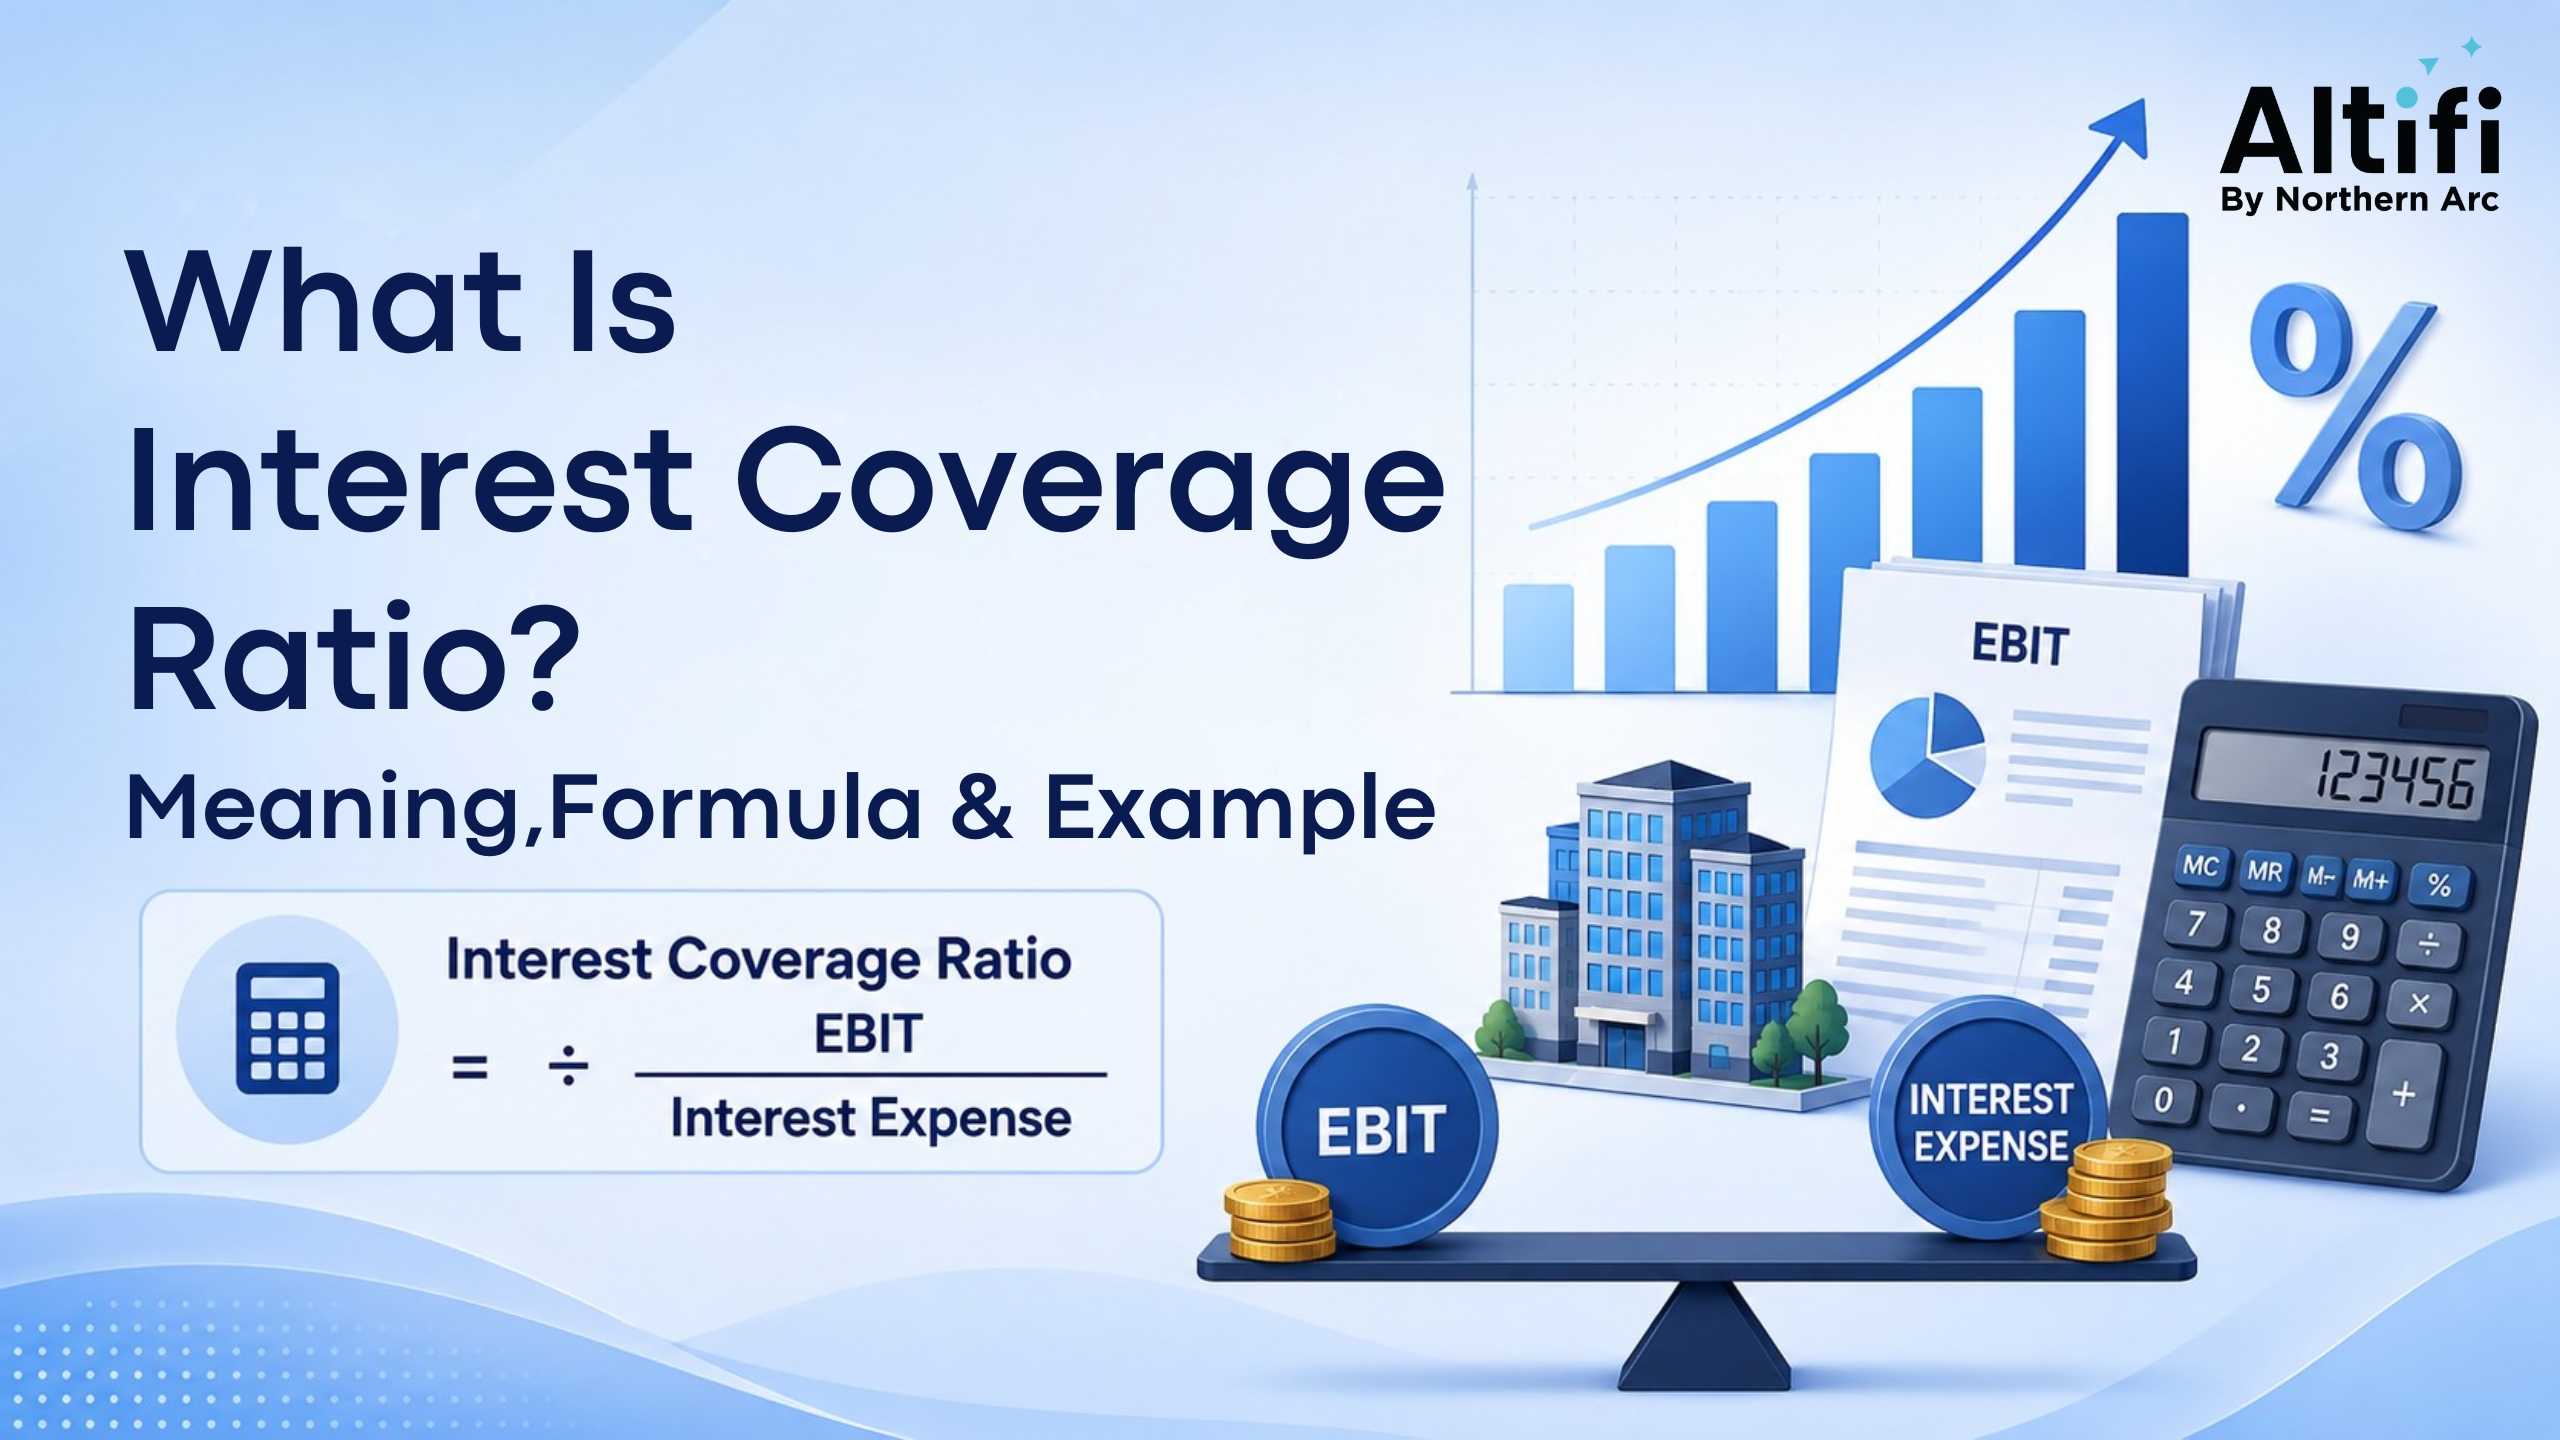
Any firm that raises finance through borrowing has to pay interest charges irrespective of how well it performs during any given period. The interest coverage ratio (ICR) helps answer an essential but straightforward question – whether a company can cover the interest charges on its loans by earning profits from its primary activities. The interest coverage ratio (ICR) is a standard tool of analysis among lenders, credit-rating firms, and bond investors when assessing risks before lending money or investing in corporate bonds. High ICR indicates a company is resilient to changes in business conditions; low ICR indicates otherwise. This paper explains how the ICR is calculated, illustrates an example of calculation, and discusses its importance to investors and credit ratings.
What is the Interest Coverage Ratio (ICR)?
ICR is defined as the times that a company’s operating income can cover its interest expenses. It is also referred to as the "times interest earned." It shows how many times a company can afford its interest payment in terms of its income from operations. Simply put, the ICR represents the safety margin a company has before its earnings level becomes insufficient for covering its interest payments.
High ICR indicates that the company has enough operating earnings to make interest payments. A low ICR shows that the company is almost out of its margin of safety and that any decrease in its income would cause trouble.
How is the Interest Coverage Ratio Calculated?
The formula is straightforward:
Interest Coverage Ratio = Earnings Before Interest and Taxes (EBIT) / Interest Expense
Some analysts also use an adjusted version. One approach uses earnings before interest, taxes, depreciation, and amortisation (EBITDA) to determine how many times these earnings can cover interest expenses, which gives a clearer picture of cash flow by excluding non-cash charges.
Step-by-step calculation:
- Find the company's EBIT (or EBITDA) from its income statement.
- Find the total interest expense for the same period.
- Divide EBIT by interest expense.
- The result shows how many "times" the company can cover its interest payments.
Interest Coverage Ratio Calculation Example
Suppose a company reports the following figures for the year:
- Operating income (EBIT): ₹500,000
- Interest expense: ₹60,000
ICR = 500,000 / 60,000 = 8.33
This means the company earns more than eight times what it needs to pay in interest. This is considered a strong position, since even a significant drop in profit would still leave enough cushion to service debt comfortably.
Now consider a second company:
- EBIT: ₹150,000
- Interest expense: ₹120,000
ICR = 150,000 / 120,000 = 1.25
This company earns only 1.25 times its interest obligation. Since this is on the lower side, it may struggle if earnings decline even slightly.
How To Interpret Interest Coverage Ratio (ICR)
Interpreting ICR depends on where the number falls:
Above 3.0
Between 3.0x and 5.0x is generally seen as adequate for stable businesses, and credit rating agencies typically view this range as consistent with investment-grade credit for companies with predictable cash flows.
Between 2.0 and 3.0
This is often called the "watch zone" — coverage exists, but a 30–50% decline in operating earnings could threaten it.
Below 1.5
A ratio below 1.5 may may indicate increased financial risk and could lead lenders to refuse further credit.
Below 1.0
This indicates that a company's earnings are insufficient to cover its interest expenses, which is a significant red flag for financial health and solvency.
A general rule followed by many analysts: a ratio of 2.00 or above is generally considered good, meaning earnings are at least twice the interest obligation. However, industry context matters — manufacturing firms usually need a higher ICR due to their capital-intensive nature, while tech companies with less debt often maintain lower ICRs.
Limitations of the Interest Coverage Ratio
While useful, the ICR has certain limitations that analysts should keep in mind:
Ignores principal repayment
The ratio only measures interest coverage, not the ability to repay the loan's principal amount.
Varies by industry
A "good" ratio in one sector may be poor in another, since capital intensity and profit margins differ widely.
Sensitive to earnings volatility
Companies with cyclical earnings can show a healthy ratio in good years and a weak one in downturns.
Undefined for debt-free companies
Companies with no interest-bearing debt produce an undefined ratio, since there is no denominator, even though this is actually the strongest financial position.
Doesn't account for cash reserves
A company with a low ICR but large cash balances may still be able to meet its obligations comfortably.
Backward-looking
It is based on past financial statements and may not reflect sudden changes in interest rates or earnings.
Why the Interest Coverage Ratio Matters for Bond Investors
Bond investors rely heavily on the ICR to determine the safety of their investment before committing capital. Before purchasing corporate bonds, investors examine the issuer's Interest Coverage Ratio to assess the safety of their interest payments, since a company with a higher ratio presents substantially lower risk than one with a lower ratio, and bond prices reflect this risk difference. A company that struggles to cover its interest payments is more likely to default on bond coupons, which directly threatens an investor's expected returns. For this reason, bond investors often compare a company's ICR trend over several years, rather than looking at a single year in isolation, to check whether financial strength is improving or deteriorating.
How the Interest Coverage Ratio Affects Credit Ratings
ICR plays a very key role in credit rating agencies in the process of assigning ratings to the debt of the corporation. Credit rating agencies consider the Interest Coverage Ratio as one of several important financial metrics while assigning ratings. A higher ICR generally supports stronger credit quality, but ratings depend on a comprehensive assessment of business and financial risks. The more favourable the ratio, the higher the credit rating, which results in a lower cost of borrowing for the corporation.
Conclusion
The Interest Coverage Ratio is a very basic yet effective method of determining the ease with which a firm is able to meet its interest obligations through its core earnings. An increasing ratio means strong finances and decreased risk of default, whereas a declining ratio may mean problems for the future. Though there are shortcomings in this ratio, like the fact that it doesn’t consider the principal and that it differs from industry to industry, it still plays an important role in lending and investment decisions.
FAQs on Interest Coverage Ratio
What is a good Interest Coverage Ratio?
Any number that is 2.0 or higher is considered a good ratio, whereas ratios that are 3.0 or higher can be classified as good ratios and usually denote investment-grade credit ratings.
What does an Interest Coverage Ratio below 1 indicate?
This implies that the profits made by the firm cannot sustain the interest payments, thereby making the firm use cash on hand, dispose of assets, or raise additional funds in order to meet interest expenses.
Why is the Interest Coverage Ratio important?
It helps lenders, investors, and rating agencies assess a company's ability to meet debt obligations and avoid default, directly influencing borrowing costs and investment decisions.
Why do bond investors consider the Interest Coverage Ratio before investing?
Because it indicates the safety of future interest payments; a low ratio raises the risk that a company may fail to pay bond coupons on time.
How does ICR differ from DSCR?
ICR measures coverage of interest expense alone using EBIT or EBITDA, while the Debt Service Coverage Ratio (DSCR) measures a company's ability to cover both interest and principal repayments, giving a broader view of total debt obligations.
Disclaimer:
The information contained in this newsletter (“Newsletter”) is for general informational purposes only. Northern Arc Capital Limited (“Northern Arc”) does not make any warranties about the completeness, reliability, and accuracy of this information. Any action you take upon the information contained in this Newsletter is strictly at your own risk, and Northern Arc will not be liable for any losses and damages in connection with the use of our Newsletter.
The data included in this Newsletter has been obtained from sources that are believed to be reliable and accurate at the time of publication. However, Northern Arc does not guarantee the accuracy or completeness of any information, nor does it assume any responsibility or liability for any errors or omissions therein. Any opinions expressed herein are subject to change without notice and Northern Arc is under no obligation to update or keep current the information contained in this Newsletter.
This Newsletter is not intended to constitute, and should not be construed as, investment advice or a recommendation to purchase, sell, or hold any security or to engage in any investment strategy or transaction. Readers should not rely solely on the information provided in this Newsletter for making investment decisions and should conduct their own due diligence or seek the advice of a qualified professional.
The content of this Newsletter is for informational purposes only and is not a solicitation or an offer to buy or sell any securities or financial instruments. Northern Arc is not responsible for any investment decisions made by the recipients of this Newsletter. Readers should take independent financial advice from a qualified professional in connection with, or independently research and verify, any information that is provided in this Newsletter and wish to rely upon, whether for the purpose of making an investment decision or otherwise.
Northern Arc and its affiliates, directors, employees, and agents expressly disclaim any and all liability for any direct or indirect losses, damages, or expenses of any kind arising out of or relating to the use of this Newsletter, including but not limited to, any losses related to the accuracy, completeness, timeliness, or reliability of such information.
This Newsletter may contain forward-looking statements that are based on current expectations, estimates, forecasts, and projections about the markets in which Northern Arc operates, as well as management’s beliefs and assumptions. Forward-looking statements are not guarantees of future performance and involve certain risks and uncertainties, which are difficult to predict. Past performance is not indicative of future results.
This report is intended solely for the recipient and is not for further circulation. Any distribution, modification, reproduction, or disclosure of the contents of this Newsletter, in whole or in part, without the prior written consent of Northern Arc, is strictly prohibited.